Real life biomedical data is usually noisy, which makes it difficult to analyze. Recent adoption of visual analytics to the analysis of such data is allowing easier recognition of multivariate correlations and underlying biological processes. Visual analytics is well suited for hypothesis generation, which can be tested statistically and experimentally.
We use bipartite network representations to study relationships between metabolites, subjects, taxonomical units, genes, etc. Relationships can be direct measurements or inferred such as correlations between two or more measurements in the same set of subjects.

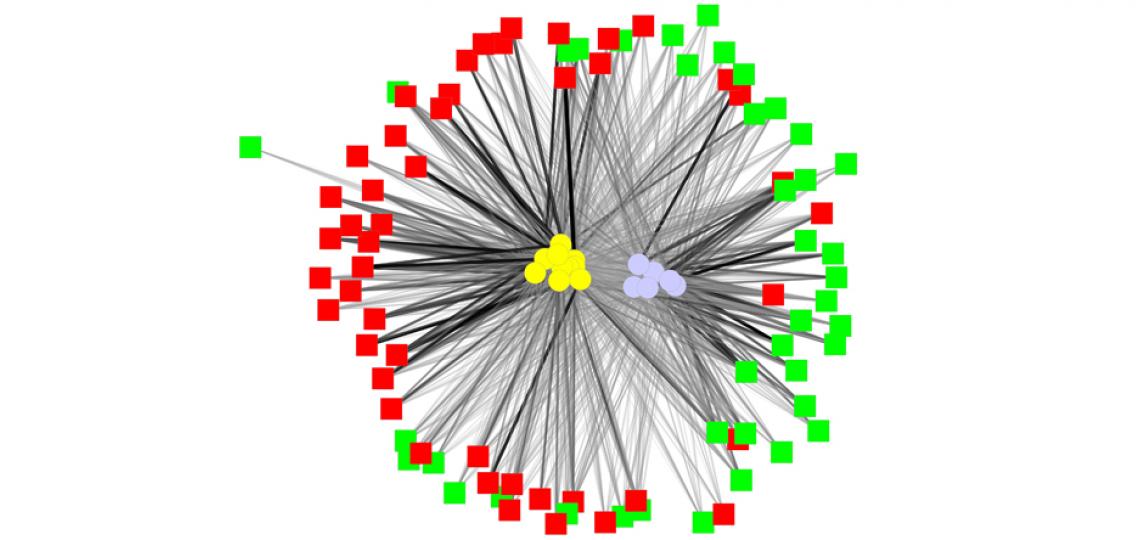
Pediatric IBS subject-metabolite network: Red and green squares represent IBS patients and healthy controls. In yellow and light blue circles the layout also shows two different metabolite clusters. These clusters are clearly associated with IBS and healthy control and can be potentially used as IBS biomarkers.

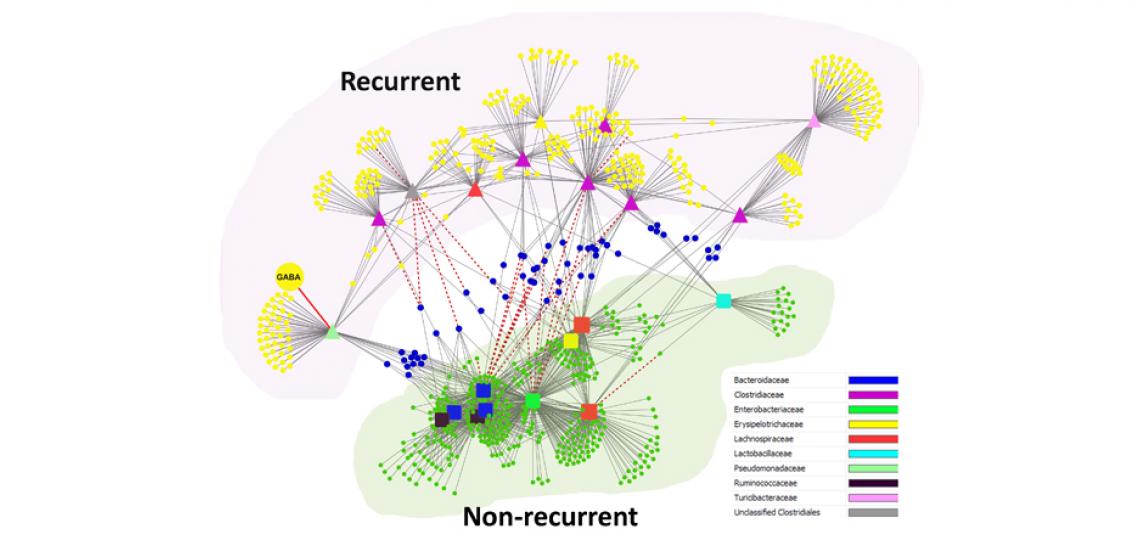
Metabolite-taxonomical unit correlation network inferred from measurements in the same set of Clostridium Difficile infected subjects shows a clear separation of metabolites and taxonomical units that are associated with recurrent and non-recurrent disease.


