Children's BMI & Energy Requirement Calculator
Click, tap or hover over Blue Text to popup helpful information.
Use this calculator to determine whether a child is at a healthy weight for his/her height, age and sex. The BMI-percentile-for-age calculator automatically adjusts for differences in height, age and sex, making it one of the best tools for evaluating a growing child's weight.
The calculator will also calculate a child's estimated energy requirement. This is the amount of energy your body needs to carry out physical functions. It is affected by body size and composition, by food intake and by physical activity.
Enter your information into the form below, then click the Calculate button. All fields are required. Dates should be entered in "mm/dd/yyyy" format.
To help put a child's growth into perspective, compare height & weight with age- and sex-specific references.
Interpreting the results
BMI categories for children and teens are based on sex- and age-specific BMI percentiles.
| BMI Categories for Children and Teens | ||
| BMI Percentile for Age | BMI Category | |
| Less than 5% | Underweight | |
| 5% to less than 85% | Healthy Weight | |
| 85% to less than 95% | Overweight | |
| Equal to or greater than 95% | Obese | |
| 120% of the 95th percentile | Class 2 Obesity | |
| 140% of the 95th percentile | Class 3 Obesity | |
Should I be concerned if my daughter is in the 75th percentile on the
graph?
Not if that is where she has tended to be on the graph in the past (see tracking your child's weight
below). Being in the 75th percentile means that after adjusting for differences in height your
daughter is heavier than 75 percent of girls her age (and lighter than 25 percent), which,
according to the CDC guidelines, puts her at a healthy weight-for-age.
Energy Balance
The human body needs energy to sustain the body's various functions, such as respiration, circulation, physical work, and protein synthesis. This energy comes from dietary carbohydrates, proteins, and fats. Energy balance depends on an individual's dietary energy intake and energy expenditure. The Estimated Energy Requirement (EER) is the average dietary energy intake that is predicted to maintain a person's energy balance depending on age, sex, weight, height, physical activity, and life stage, consistent with maintaining health. The EER can supply guidance for supporting energy balance on both an individual and group level.
Understanding your BMI results
What to do if your child's BMI-for-age indicates that he or she is...
in the overweight or obese category
The body mass index (BMI) and BMI-percentile-for-age (BMI%) do not directly measure body fat. So, while the majority of children with a BMI% over the 85th percentile have too much body fat, very athletic kids, particularly very active athletic African American teenage boys, can have a high BMI-for-age due to extra muscle mass, not excess body fat. Therefore, it's important that children with a BMI% over the 85th percentile be evaluated by a health professional.
The CNRC has some excellent resources for parents concerned about their child's body weight, including Helping Your Child with Successful Weight Management (also in Spanish), Healthy Eating articles, a Kids' Healthy Me learning tool, and links to Childhood Obesity resources on the Internet.
If you suspect a medical condition is causing your child to be overweight or if you suspect your child is developing or has an eating disorder, consult your child's physician.
in the underweight category
For very thin children who are growing and developing normally, are eating a healthy diet, and are active, having a BMI% below the 15th percentile should be considered normal — some children are just thin.
However, if a child has stopped gaining weight or has recently lost weight, has diarrhea or vomiting, poor appetite, a severely restricted diet, and/or low energy levels, a low BMI% could signal a medical problem or an eating disorder that deserves attention. Children developing eating disorders tend to voice concerns over age appropriate weight gains or feel a need to lose weight, have a poor self-body image, or exercise excessively. Girls can lose their regular menstrual cycle. Although more common among girls, eating disorders can also affect boys.
If you suspect a medical condition is causing your child to be underweight or if you suspect your child is developing or has an eating disorder, consult your child's physician.
Tracking Your Child's Weight
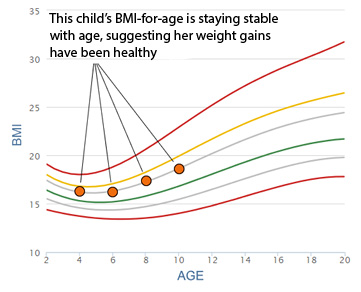
Plotting a child's BMI on the proper CDC growth chart (see charts below) can alert parents to early signs that their child is gaining weight too fast. Parents can help their child avoid developing weight problems by making small changes in their family's diet and physical activity habits. According to Roman Shypailo, a CNRC body composition expert who developed the calculator, parents who plot the calculator results should watch for significant 'drifting', either up or down, in their child's BMI% over time.
For example, a 62-pound, 50-inch tall, 8-year-old girl has a BMI of 17.5 that puts her at the 77th percentile for age. This is a healthy weight for her age and her parents should expect future weight gains to keep her BMI-for-age 'tracking' along the 77th percentile as she gets older.
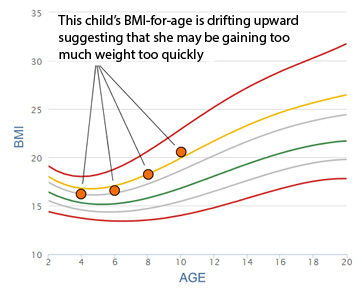
However, that same 77th percentile could be a 'red flag' for poor diet and/or physical activity habits if it reveals an upward drifting of her BMI%, perhaps from the 66th percentile at age 6 to the 77th at age 8. This 'early warning' enables parents to catch potentially unhealthy changes in a child's weight at an early age, when making changes in diet and exercise to correct the problem are easier.
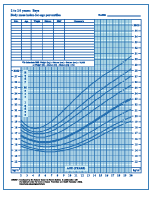
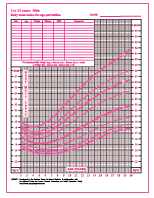
To track changes in your child's BMI-for-age
- Click on the appropriate growth chart below to open a full-size chart (PDF) suitable for printing. Plot your child's BMI against your child's age on this chart.
- About every 6 months, return to this page to recalculate your child's BMI, BMI Percentile, and Energy needs. Update the chart with the new data.
Please Note
Individual results, when compared to other children, can be affected by many factors such as the parents' body sizes and the child's level of physical maturity. Thus, this software should not be used for medical diagnostic or treatment purposes. Additionally, the authors and their affiliated institutions are not liable for any damages to users or third parties arising from the use of this software.
This software is protected under international copyright law. Unauthorized duplication or distribution is a violation of copyright. Entering this section of the web site implies acceptance of the conditions stated above.
References
(1) Centers for Disease Control and Prevention (CDC). National Center for Health Statistics (NCHS). National Health and Nutrition Examination Survey Data. Hyattsville, MD: U.S. Department of Health and Human Services, Centers for Disease Control and Prevention, 2004, http://www.cdc.gov/growthcharts/percentile_data_files.htm.
(2) National Academies of Sciences, Engineering, and Medicine. 2023. Dietary Reference Intakes for Energy. Washington, DC: The National Academies Press. https://doi.org/10.17226/26818.