

Pediatric Body Composition Reference Charts
Age-based Growth Reference Charts
Graph Layout  Mouseover Info
If you mouse-over the graphs, you'll see the data values for points you hover over.

The pop-up will identify the percentile line, followed by the age (yrs), then the value being graphed (BMI, weight, or height). Mouse-over the subject's data point to see the subject's data values.
If you mouse-over the graphs, you'll see the data values for points you hover over.
The pop-up will identify the percentile line, followed by the age (yrs), then the value being graphed (BMI, weight, or height). Mouse-over the subject's data point to see the subject's data values.
The graphs show percentile levels at each age for each measurement, based on a national representative population. You can mouse-over the graphs to see the data values.
Age-based DXA Reference Charts
Height-based DXA Reference Charts
Data for the BMI, Weight, and Height graphs come from U.S. Growth Charts (2000), National Center for Health Statistics (NCHS), Centers for Disease Control and Prevention (CDC), U.S. Department of Health and Human Services.
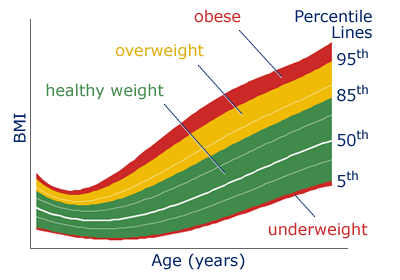
The American Academy of Pediatrics (AAP) and the U.S. Centers for Disease Control and Prevention (CDC) recommend the use of BMI to screen for overweight and obesity in children beginning at 2 years old.
BMI-for-age weight status categories and their related percentile ranges are shown in the following table:
| BMI for Age - Weight Status Categories | |
| A BMI Percentile of: | Suggests that a child is: |
| Less than the 5th percentile | Underweight |
| 5th percentile to less than the 85th percentile | Healthy Weight |
| 85th to less than the 95th percentile | Overweight |
| Equal to or greater than the 95th percentile | Obese |
DXA references come from the National Health and Nutrition Examination Survey (NHANES) - DXA data released in 2008. Correction factors were derived by Kelly et al:
Kelly TL, Wilson KE, Heymsfield SB (2009) Dual Energy X-Ray Absorptiometry Body Composition Reference Values from NHANES. PLoS ONE 4(9): e7038. doi:10.1371/journal.pone.0007038
IMPORTANT: The DXA calculators work with data acquired by HOLOGIC instruments and can adjust for different analysis versions. Prior to the release of NHANES DXA data,
- NHANES results for children weighing 40 kg (88 lbs) or less were adjusted leading to changes in BMC, BMD, Fat, and Lean (by using the Auto-WB Analysis Option available on Hologic DXA instruments starting with version 12).
- NHANES lean soft tissue mass and fat mass were then further adjusted for all subjects. "Lean mass was decreased by 5% and an equivalent kilogram weight added to the fat mass so the total mass did not change."
Quoted from the NHANES "Documentation, Codebook, and Frequencies" document published in January, 2008. The adjustments to DXA results were incorporated into the NHANES dataset by investigators at the CDC prior to release of the DXA reference data.This analysis option (NHANES BCA) appears on Hologic DXA instruments starting with version 13.
The DXA graphs dealing with Lean tissue, presented by Kelly et al, actually work with fat-free mass (FFM) although they are labeled as 'Lean', thus the graphs presented here are labeled FFM/Ht2 vs Age, and FFM vs Height. (FFM = Lean + BMC)
Before entering DXA values, you should know whether your results incorporate the 40-kg automatic whole-body corrections (Auto-WB) and/or the 5% Lean-Fat adjustment (NHANES BCA calibration), then choose your SW Version accordingly.
Verify that you are entering LEAN values, not FFM values.
Data Source
The tools provided here are based on publicly available data from the National Health and Nutrition Examination Survey (Centers for Disease Control and Prevention, U.S. Department of Health and Human Services). Individual results, when compared to other children, can be affected by many factors such as the parents' body sizes and the child's level of physical maturity. Thus, this software should not be used for medical diagnostic or treatment purposes. Additionally, the authors and their affiliated institutions are not liable for any damages to users or third parties arising from the use of this software.
This software is protected under international copyright law. Unauthorized duplication or distribution is a violation of copyright. Entering this section of the web site implies acceptance of the conditions stated above.
Supporting Publications
Kelly TL, Wilson KE, Heymsfield SB. Dual Energy X-Ray Absorptiometry Body Composition Reference Values from NHANES. PLoS ONE 2009; 4(9): e7038. doi:10.1371/journal.pone.0007038
Shypailo RJ, Butte NF, Ellis KJ. DXA: Can It Be Used as a Criterion Reference for Body Fat Measurements in Children? Obesity (Silver Spring) 2008 Feb; 16(2): 457-62.
Shypailo RJ, Ellis KJ. Bone assessment in children: Comparison of fan-beam DXA analysis. Journal of Clinical Densitometry 2005; 8(4): 445-453.
Ellis KJ, Shypailo RJ, Hardin DS, Perez MD, Motil KJ, Wong WW, Abrams SA. Z score prediction model for assessment of bone mineral content in pediatric diseases. Journal of Bone and Mineral Research 2001; 16(9): 1658-1664.
USDA/ARS
Children's Nutrition Research Center
1100 Bates Street, Houston, Texas 77030
© Copyright 2000-2017 Baylor
College of Medicine. All Rights Reserved.
Contact
Us.